In the previous post we wrapped an IBM i business logic program into an easy to consume API with Mulesoft Anypoint platform and IBM i Connector. Took just under 15 minutes to build and works like a charm at the first try. Right… in real life there are quite a few things that could go wrong with remote program call. Most commonly the issues are caused by the incorrect parameter definitions, where parameter mode, data type or length or sequence mismatch cause the program to bomb. The connector logs the exception and the trace, however in some cases it’s really useful to take a look at what’s going on during program execution. In this article, contributed by Vivek Gupta, we show how to debug IBM i program called from Mule API. Vivek is one of very few people in the whole world (and most of them are on our team!) who develops both Mulesoft and IBM i components for the same project.
At high level, debugging IBM i program called from Mule API is similar to debugging other batch jobs:
- Determine the remote execution job name, user ID and job number using WRKACTJOB SBS(QUSRWRK) command
- Start service job that pairs interactive session with the connector job using STRSVRJOB command
- Start debug using STRDBG command and add a breakpoint in the debug UI
- Execute the Mule API that calls the IBM i program – when the program hits the breakpoint, it will pause on that line in the paired interactive session and the developer can step through the batch program operations in debug view.
Sounds easy right? Except it’s not always straightforward to determine the job the program will execute under. Here’s some background on this. The IBM i connector communicates with the back-end system via IBM i *RMTCMD (Remote Command) host server. The pre-start host jobs QZRCSRVS are initially running under QUSER ID then selected by the OS to process the request under the ID specified on IBM i connector. To see all jobs including prestart ones, use command
[code]WRKACTJOB SBS(QUSRWRK)[/code]
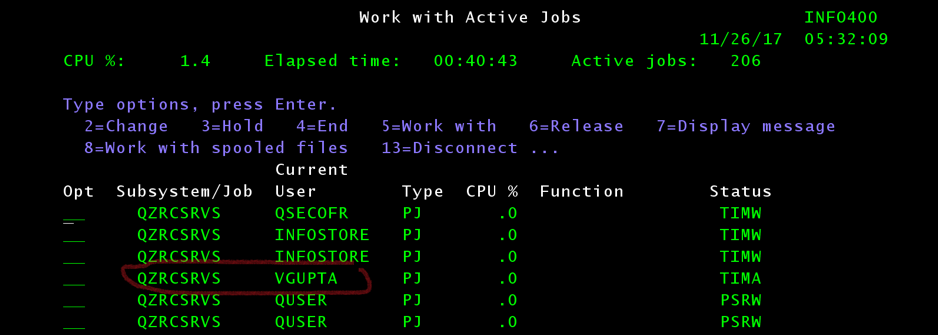
Then press F14 (Shift + F2) to include prestart jobs. You will see a number of QZRCSRVS jobs in the subsystem:
These jobs are just sitting there waiting to be called by the clients, much like the connection pool threads. There’s no easy way to determine which one of these will be selected to serve your request. If you have a luxury of having the whole system to yourself for the period of debugging, you can kill all the jobs except for one, which will guarantee that’s the job that will be processing your request. It may also work if you hold the jobs instead of killing them, but I haven’t tested this option. The obvious downside of this option is the impact on other development or integration activities on the same system.
Another option might be to use a unique user ID for IBM i connector configuration and call the API once to establish the connection and execute the program. The connector keeps the connection jobs open between the calls therefore after the first call it will allocate one of pre-started jobs that will retain that unique user ID:
Now that we determined the remote program call job, debugging it is as easy as any batch IBM i job by following the steps above. The same approach would work for any remote command client, such as custom Java or .Net application, Tibco or webMethods or other integration platforms that enable the remote IBM i program call from the interface flows.
Before we wrap this, let us summarize some of the features of QZRCSRVS server jobs that we encountered during this exercise:
- QZRCSRVS jobs are prestart jobs that run in the QUSRWRK subsystem where the connections are routed.
- When the host servers are started, these jobs are started under profile QUSER.
- QZRCSRVS server jobs are managed by their prestart job entries defined under subsystem description for QUSRWRK.
- When you call the host server, you supply a user ID and password. The host server swaps to this supplied user ID and run the specified program.
- The program is not run under QUSER profile but under the actual AS400 user profile.
- A cleanup thread runs at predefined intervals to determine whether a QZRCSRVS job is still being used by Job Monitor. If the job is not used, it is ended.
- QZRCSRVS jobs are automatically removed after a predefined period after the job it supports end. Likewise QZRCSRVS jobs will end if the Job Monitor that created them stops, or if Management Central ends.
Integrating and modernizing legacy IBM i applications is not an easy task. Comprehensive integration platform, such as Mulesoft Anypoint with IBM i connector enable non-IBM i developers to rapidly build APIs for the back-end business logic and data. When things go wrong, troubleshooting typically requires involvement from both IBM i and integration teams, and often takes time. In these scenarios it is especially beneficial to have a team or a developer who can troubleshoot both Mule and IBM i sides. As the popularity of Mulesoft platform among IBM i shops grows, I hope to see more and more IBM i developers being trained on Mule, meanwhile the Infoview team is always here to assist!


Recent Comments